Effects of incoming polygonal fault systems on subduction zone and slow slip behavior(Science Advances)
Title
Effects of incoming polygonal fault systems on subduction zone and slow slip behavior
Authors
Maomao Wang1*, Philip M. Barnes2, Demian Saffer3, Gregory F. Moore4, Haoran Ma1, Ming Wang1, Jinbao Su1
- College of Oceanography, hohai University, nanjing, Jiangsu, china.
- National in stitute of Water and Atmospheric Research, Wellington, new Zealand
- University of texas institute for Geophysics, Austin, tX, USA
- Department of earth Sciences, University of hawaii, honolulu, hi, USA
- Correspondence to: Maomao Wang(wangmm@hhu.edu.cn)
Abstract
The physical properties of subduction inputs profoundly influence megathrust slip behavior. Seismic data reveal extensive polygonal fault systems (PFSs) in the input sequences of the Hikurangi Margin and Nankai Trough. The mechanical and hydrological effects of these incoming PFSs on subduction zones are potentially substantial. Here, we investigate their effects following transport into the accretionary wedge by integrating discrete- element modeling with three- dimensional seismic interpretation. We find that the typical dips of the incoming PFSs over lap with modeled dips prone to reactivation and confirm that subducting PFSs can be reactivated and gradually evolve into major thrust faults. Comparisons with electromagnetic data indicate that PFSs may provide conduits for fluid leakage along the plate interface, coincide with disrupted strata and decreased shear stress, and enhance geometric and stress heterogeneity along the megathrust. These suggest that PFSs may play a previously unrec ognized role in contributing to shallow slow earthquake phenomena in subduction zones
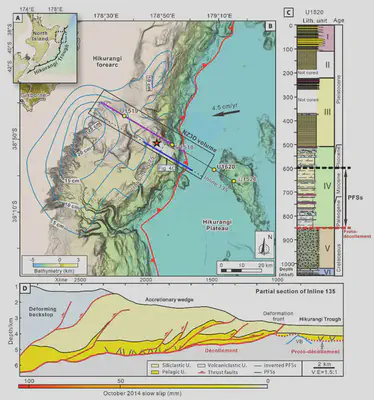
Figure 2. Bathymetric map showing the location of the NZ3D seismic volume at the northern Hikurangi Margin.
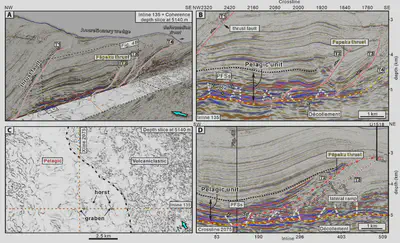
Figure 4. Seismic profiles and coherence depth slice from the NZ3D reflection volume showing accreted PFSs and thrust faults in the Hikurangi Margin.
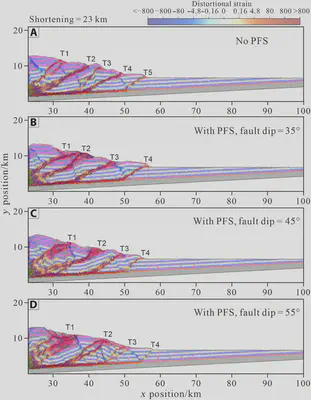
Figure 6. Comparison of structural deformation without and with polygonal faults in accretionary wedges based on DEM simulation.
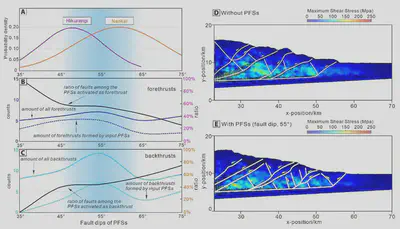
Figure 7. Statistical data for modeled fault structures and maximum shear stresses field in the accretionary wedge.
References
Due to space limitations, please refer to the full list of references:Wang M, Barnes P M, Saffer D, et al. (2025). Effects of incoming polygonal fault systems on subduction zone and slow slip behavior. Science Advances, 11(27): eadu4227. https://www.science.org/doi/epdf/10.1126/sciadv.adu4227