Quantitative Analysis and Simulation of Compressional Tectonics Based on Discrete Element Method (Tectonics and Mineralization)
Download:
- Li Changsheng, Yin Hongwei, Xu Wenqiao, Wu Zhenyun, Guan Shuwei, Jia Dong, Ren Rong. Quantitative analysis and simulation of compaction structures based on discrete element method [J]. Geotectonica et Metallogenia, 2022, 46(04): 645-661.
- The corresponding ZDEM script is provided later in the text.
The discrete element method (DEM) holds immense potential in the quantitative study of tectonic deformation, stress-strain relationships, and fracture prediction, making it one of the primary directions for future research in quantitative tectonic deformation studies.
Title
Quantitative Analysis and Simulation of Compressional Tectonics Based on Discrete Element Method
Authors
Changsheng Li1,2,3,4, Hongwei Yin3*, Wenqiao Xu3, Zhenyun Wu1, 2, Shuwei Guan4, Dong Jia3, Rong Ren4
- State Key Laboratory of Nuclear Resources and Environment, East China University of Technology, Nanchang, China
- School of Earth Sciences, East China University of Technology, Nanchang, China
- School of Earth Sciences and Engineering, Nanjing University, Nanjing, China
- PetroChina Research Institute of Petroleum Exploration and Development, Beijing, China
Abstract
With advancements in discrete element theory and computer technology, DEM has been widely applied to tectonic simulations across various scales. Compared to traditional sandbox experiments, DEM allows for more precise control of experimental boundary conditions and quantitative analysis of the tectonic deformation process. This facilitates a deeper understanding of the influence of stratigraphic mechanical properties on tectonic deformation at the mesoscopic scale. This paper systematically elaborates on the quantitative analysis method for tectonic deformation based on DEM. Through a typical numerical simulation experiment of compressional tectonics using DEM, we modeled the formation process of tectonic structures under horizontal compression. The study analyzed the changes in stress and strain distribution, as well as the patterns of fracture generation during deformation, yielding the following insights:(1) The simulated tectonics are dominated by foreland-style imbricate thrust faults, with fault activity propagating sequentially from the compression end to regions farther away;(2) Fractures are closely related to fault formation, with the accumulation of numerous fractures in local areas acting as a trigger for fault development;(3) In the early stages of fault formation, material displacement within the fault is minimal, and the incremental increase in fractures is at its peak; in the later stages of fault activity, the incremental increase in fractures decreases;(4) Volumetric strain can characterize fracture types (tensile or compressive), while deformation strain can distinguish between forward and reverse thrust faults;(5) The magnitude of average stress is positively correlated with topographic relief, and the maximum shear stress continuously accumulates at the site of an impending new fault until the fault forms, after which the maximum shear stress dissipates, propagates forward, and accumulates at the next site of an impending fault. These findings demonstrate the significant potential of DEM in the quantitative study of tectonic deformation, stress-strain relationships, and fracture prediction.
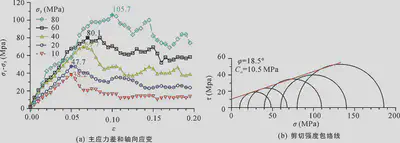
Figure 2: Biaxial Experiment Results
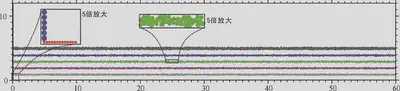
Figure 3: Initial Model
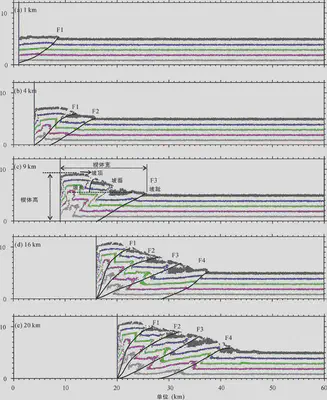
Figure 4: Structural Interpretation of the Wedge at Model Contraction of 1 km (a), 4 km (b), 9 km (c), 16 km (d), and 20 km (e)
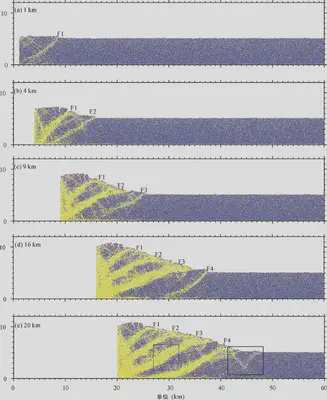
Figure 6: Bonded Force Chain Distribution at Contraction of 1 km (a), 4 km (b), 9 km (c), 16 km (d), and 20 km (e) (Blue represents bonded force chains, yellow represents unbonded contacts)
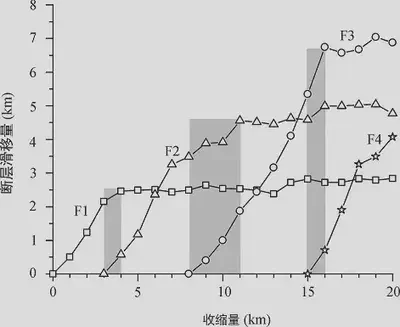
Figure 8: Fault Slip Curves as a Function of Contraction (Faults F1, F2, F3, and F4 as shown in Figure 4; fault slip values measured from the green layer)
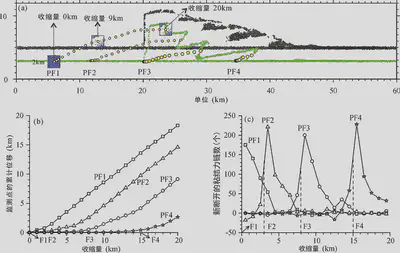
Figure 9: Motion Paths of Points PF1, PF2, PF3, and PF4 (a); Cumulative Displacement of Points PF1, PF2, PF3, and PF4 with Model Contraction (b); Number of Newly Broken Bonded Force Chains within a 1 km Radius Around Points PF1, PF2, PF3, and PF4 per 1 km of Model Contraction\(c)
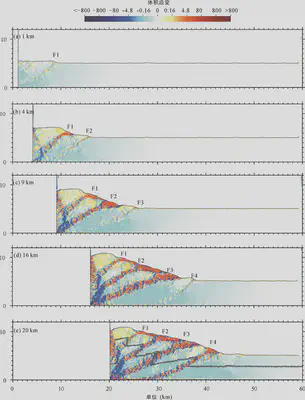
Figure 10: Cumulative Volumetric Strain in the Model at Contraction of 1 km (a), 4 km (b), 9 km (c), 16 km (d), and 20 km (e)
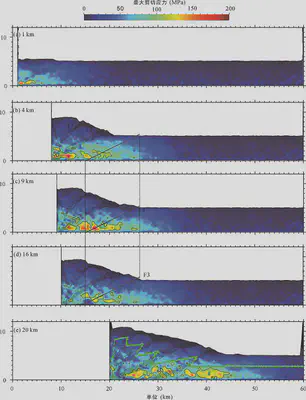
Figure 15: Maximum Shear Stress Distribution at Contraction of 1 km (a), 4 km (b), 9 km (c), 16 km (d), and 20 km (e)
Acknowledgments
The numerical computations in this study were performed on the computing cluster at Nanjing University’s High-Performance Computing Center. The numerical simulation experiments were conducted using discrete element simulation software independently developed by our research group. For more examples of tectonic simulations, see https://geovbox.com. The strain calculation code used in this paper was adapted from scripts by Julia K. Morgan and Thomas Fournier of Rice University, to whom we express our gratitude. The source code for the wedge element measurement program is available at https://github.com/demsheng/Quantitative-wedge. Associate Professors Yu Yixin and Liu Zhina from China University of Petroleum (Beijing) provided thorough and professional reviews of this paper, offering constructive suggestions for improvement, for which we extend our special thanks.
ZDEM Script Code
-
Sedimentation Process.gen.py The content of is as follows:
###################################### # title: 基于离散元的挤压构造定量分析与模拟:1 沉积 # date: 2022-09-01 # authors: 李长圣 # E-mail: sheng0619@163.com # ref: [李长圣,尹宏伟,徐雯峤,吴珍云,管树巍,贾 东,任 荣.基于离散元的挤压构造定量分析与模拟[J].大地构造与成矿学,2022,(46卷04):645-661.](https://doi.org/10.16539/j.ddgzyckx.2022.04.001) # more info, see www.geovbox.com ####################################### start set disk 0 BOX left 0.1 right 62000.0 bottom 1.0 height 20000.0 kn=4e10 ks=4e10 fric 0.00 GLINE P1 ( 1000.0 , 1000.0 ) P2 ( 61200.0 , 1000.0 ) r 40.0 GROUP bom_wall GLINE P1 ( 1000.0 , 1120.0 ) P2 ( 1000.0 , 19000.0 ) r 80.0 GROUP lef_wall GLINE P1 ( 61000.0 , 1120.0 ) P2 ( 61000.0 , 19000.0 ) r 80.0 GROUP rig_wall GEN num 200000, rad discrete 60.0 80.0, x ( 1000 61000), y (1000 16000), COLOR black PROP den 2.5e3, fric 0.0, shear 2.9e9, poiss 0.2, damp 0.4 hertz prop color blue range group bom_wall prop color black range group lef_wall prop color black range group rig_wall fix x y spin range group bom_wall fix x y spin range group lef_wall fix x y spin range group rig_wall SET DT 5e-2, GRAVITY ( 0.0, -9.8 ) PROP damp 0.4 DRAW INTERVAL 1000, bfill wall bondc ;,bid,bang mesh, cforce SET stepbar 1000 SET save 50000 set print 1000 set ps 1000 CYC 5000 del range x 1001 60999 y 7000 99999 CYC 5000 exp init6km_xyr.dat range x 1001.0 60999.0 y 1001.0 99999.0 del range x 1001 60999 y 6000 99999 CYC 5000 exp init5km_xyr.dat range x 1001.0 60999.0 y 1001.0 99999.0 stop -
Compression Process.push.py The content of is as follows:
During the sedimentation process, particles are randomly generated, which may result in differences between the initial model and that described in the paper. Download the initial model from the paper:init5km_xyr.dat
######################################
# title: 基于离散元的挤压构造定量分析与模拟:2 挤压
# date: 2022-09-01
# authors: 李长圣
# E-mail: sheng0619@163.com
# ref: [李长圣,尹宏伟,徐雯峤,吴珍云,管树巍,贾 东,任 荣.基于离散元的挤压构造定量分析与模拟[J].大地构造与成矿学,2022,(46卷04):645-661.](https://doi.org/10.16539/j.ddgzyckx.2022.04.001)
# more info, see www.geovbox.com
#######################################
load init5km_xyr.dat

set disk 0
BOX left 0.1 right 62000.0 bottom 1.0 height 20000.0 kn=4e10 ks=4e10 fric 0.00
GLINE P1 (   1000.0 ,  1000.0 ) P2 (  61200.0 ,   1000.0 ) r 40.0 GROUP bom_wall
GLINE P1 (   1000.0 ,  1120.0 ) P2 (   1000.0 ,  19000.0 ) r 80.0 GROUP lef_wall
GLINE P1 (  61000.0 ,  1120.0 ) P2 (  61000.0 ,  19000.0 ) r 80.0 GROUP rig_wall

PROP color white den 2.5e3, fric 0.0, shear 2.9e9, poiss 0.2, hertz

prop color blue    range group bom_wall
prop color black   range group lef_wall
prop color black   range group rig_wall
fix x y   spin range group bom_wall
fix x y   spin range group lef_wall
fix x y   spin range group rig_wall

SET  DT 5e-2,  GRAVITY ( 0.0,  -9.8 )
PROP damp 0.4

SET  stepbar  1000
set  print    5000
set  ps       5000

prop   ebmod 2e8 gbmod 2e8 tstrength 1e7 sstrength 2e7 fric 0.3 range x 1001.0 60999.0 y 1001.0  9000.0
prop color mg     range x 1001.0 60999.0 y 1700.0  2000.0
prop color violet range x 1001.0 60999.0 y 2700.0  3000.0
prop color green  range x 1001.0 60999.0 y 3700.0  4000.0
prop color blue   range x 1001.0 60999.0 y 4700.0  5000.0
prop color black  range x 1001.0 60999.0 y 5700.0  9000.0

prop color blue   fric 0.3 range group lef_wall
prop color blue   fric 0.3 range group rig_wall
prop color red    fric 0.3 range group bom_wall

ini  xv 2.0, range group lef_wall
wall id 1, nodes (  500.0 , 2000.0 )  (    500.0 ,   3000.0 ), kn=0e3 ks=0e3 color black fric 0.0  xv  2.0
imple wall id 1 xmove 20000 print 1000.0 ps 1000.0 vtk 1000.0 sav 2000.0
stop
Translator: Bao Xianjun